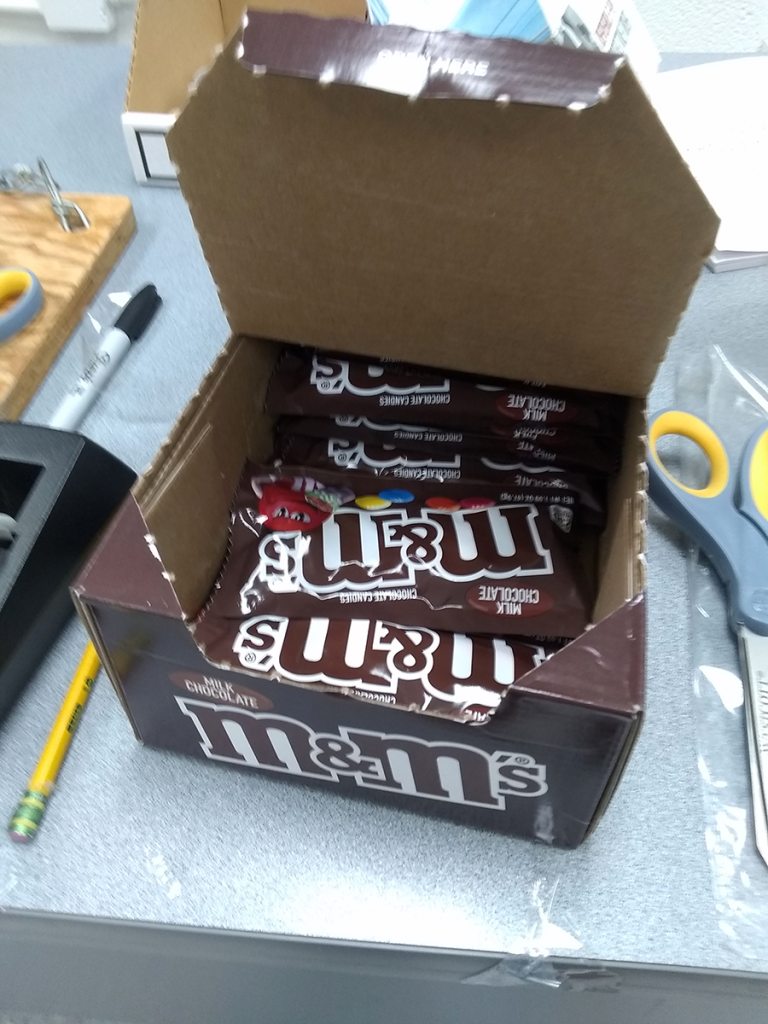
New concepts work better when there’s a hands-on element to engage students. It might be rockets, bouncy balls, lasers, or in the case of basic statistics concepts: candy. Specifically colorful candy. The physics labs have a long history of using M&Ms, though we hear that Skittles and Starbursts have their partisans, too. One bag for each student, TA, and instructor.
It’s a lot of milk chocolate.
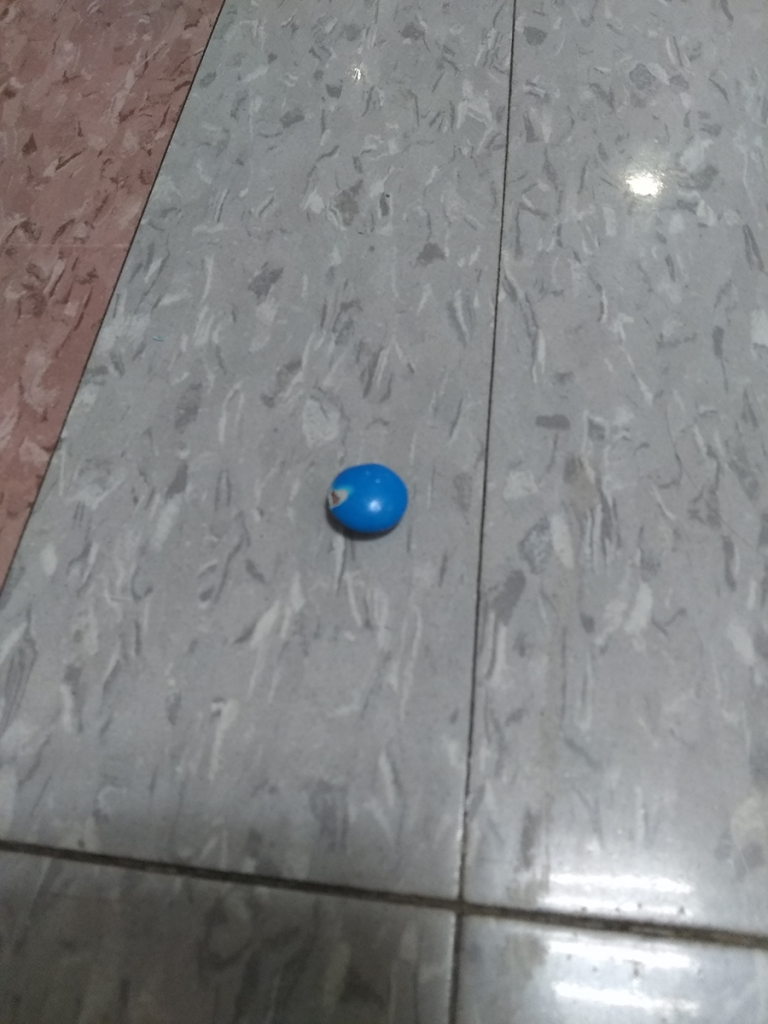
The trick is that while each bag contains about the same number of M&Ms – there’s a statistics question all its own – they come in a range of different and unevenly distributed colors. How many blues are in your bag? Opening one won’t tell you much about how many to expect in another bag, but two might. Or thirty. Or three hundred. The more data you collect, the better you can understand the range of possible blue M&Ms and the likelihood of any particular value.
It’s very helpful in a variety of topics in physics and astronomy. It’ll show up later for those students who study radioactivity, which functions in a completely random fashion on an atom-by-atom level, not revealing its predictable patterns until you look at large populations. It’s critical for understanding uncertainty in measurements, because they’re never perfect. It’s foundational for techniques in astronomy used to separate out faint signals from distant celestial objects among the electromagnetic noise of the universe.
Plus they get to eat them when they’re done.